How to make the current tax system progressive? (Part 2)
- managementpunditz

- Jun 24, 2019
- 3 min read
Updated: Jun 27, 2021
A progressive tax is a tax that imposes a lower tax rate on low-income earners compared to those with a higher income, making it based on the taxpayer’s ability to pay. That means it takes a larger percentage from high-income earners than it does from low-income individuals.
Well, tax rates are indeed very high in India. Illustration below shows who gets what from customer’s wallet.

In 2018, as per estimates, almost 98% of cars were sold with a price tag (Ex-Showroom) of less than 20 Lakhs ₹. High level of tax, in a way has dissuaded demand for premium and luxury cars in India.

Strange thing is, irrespective of value of the car, beyond 4m length, effective tax slab is not progressive in nature. For illustration, we chose the 2018 best-selling sedan’s petrol top-end models from different segments. Point is, 59 Lakhs ₹ (Ex-Showroom) Mercedes Benz E Class is taxed mere 3% higher than Maruti Ciaz, carrying 11 Lakhs ₹ price tag (Ex-Showroom).


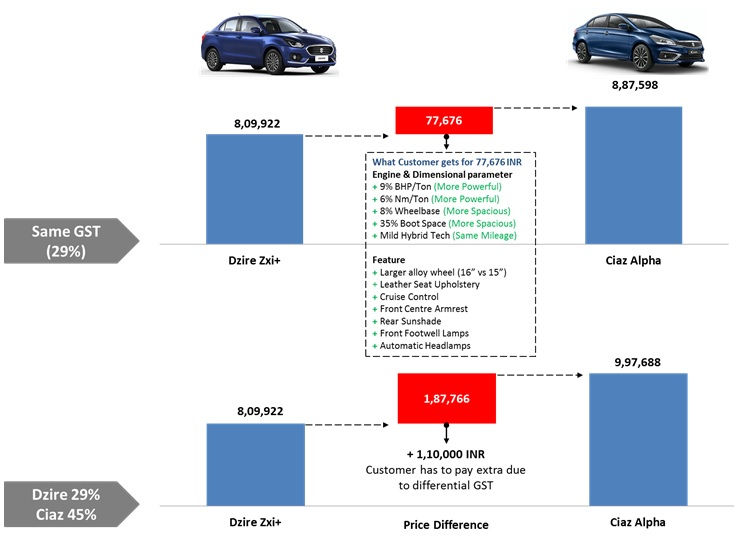
Again, comparison with a sub 4m car is inevitable here. Look at the example below, and think if Maruti Ciaz can be considered as symbol of conspicuous consumption over Maruti Dzire? Say, if both the cars are taxed at same rate, Ciaz will be mere 76,000 ₹ more expensive than Dzire, that too because of additional features and spaciousness. But the current tax structure considers it other way.

Also, companies have started offering luxury features in sub 4m cars and taking the prices to a new level, and still enjoying tax concession, basically defeating the purpose of higher differential rates to dissuade conspicuous consumption.
Since length of car is considered as a parameter of conspicuous consumption, and during biggest tax reform- 2017 GST implementation, 4m length parameter for qualifying lower tax slab was left unchanged, it seems there is a need of an intermediate tax slab, to make the tax system progressive.
Simulation
At the time of GST implementation, Government have had a chance to reform, however, fear of revenue loss has ensured that the tax level remained high. So, here we tried to take help of an economic theory called ‘Laffer Curve’ to understand, if there is a scope for reduction in taxes or introduction of an intermediate lower tax slab.
‘Laffer Curve’
In economics, the Laffer curve illustrates a theoretical relationship between rates of taxation and the resulting levels of government revenue.

It illustrates the concept of taxable income elasticity—i.e., taxable income changes in response to changes in the rate of taxation.
The Laffer curve assumes that no tax revenue is raised at the extreme tax rates of 0% and 100%, and that there is a rate between 0% and 100% that maximizes government taxation revenue.
The Laffer curve is typically represented as a graph that starts at 0% tax with zero revenue, rises to a maximum rate of revenue at an intermediate rate of taxation, and then falls again to zero revenue at a 100% tax rate.
One of the conceptual uses of the Laffer curve is to determine the rate of taxation that will raise the maximum revenue (in other words, “optimizing” revenue collection).
One implication of the Laffer curve is that reducing or increasing tax rates beyond a certain point is counter-productive for raising further tax revenue.
However, the shape of the curve is uncertain and debatable among economists.
For this study, we have focused only on 4m SUV (Monocoque), 4m Sedan (Monocoque) vs 4m-4.35m SUV (Monocoque), 4m-4.5m Sedans(Monocoque), as these are key volume segments which can impact tax revenue of Government, leaving the bigger and more expensive cars aside. For illustration, below we tried to estimate the revenue generated by the products for Companies and Governments.

Owing to higher tax rate and price, 4m+ cars certainly generate more revenue for Government than the sub 4m cars. In case of 4m car, it’s the car company which pockets larger realization from customer.

Hypothetical Case
For simulation we have reduced effective tax rate of 46%, by 7%, to new intermediate slab of 39%. Reduction of tax rate will certainly reduce the Government Revenue on face value. However, price elasticity of demand will ensure spurt in demand for 4m+ cars, leading to substitution from sub 4m cars, for simplicity we assumed that overall volume demand remains fixed (10,86,654 units in this case).

But the real world situation will be quite different. Look at the illustration below, Hyundai Creta despite having much higher price tag, sells quite well for itself, in comparison to much cheaper Maruti Brezza. So, imagine if price gap reduces, customer will switch to bigger car for a better value proposition, and may yield far better revenue for Government. In worse case also, Government will largely remain revenue neutral with the move.


This study is based on estimated data and economic theory to illustrate tax rationalization impact. Outcome of Laffer Curve is debatable, but an intermediate tax slab on more pragmatic parameters may help improving Government tax revenue collection and may also improve value for customer and better realization for companies.


